 Site Map |
|
 | Contents |
Please note, the focus of this site is local climatology which is the study of climate and past weather rather than meterology the science of forecasting the weather. For information on up to the minute local conditions and forecasts see - https://www.metoffice.gov.uk/public/weather/forecast/gcw3f198q or http://www.a-sojourn.me.uk/Weather/wx.htm or https://www.wunderground.com/personal-weather-station/dashboard?ID=IACCRING8#history/s20171122/e20171122/mdaily. |
| Latest News |
| November 2018 Sunny, dry and windy.
Autumn 2018
Met Office Outlook for December 2018
After the current rains a sluggish period is likely with a mixture of settled, drier and colder conditions with overnight frost and fog, but also with a chance of occasional outbreaks of windy and showery weather bringing a risk of snow. |
| Recent Monthly Reports |
| October 2018 A dryish sunny month with alternating mild and cool spells.
September 2018 On the wet and cool side but only a small deficiency of sunshine.
August 2018 The dullest August since 2011 and the driest since 2015.
Summer 2018
July 2018
The sunniest July in four years and the driest in twelve years.
June 2018 The sunniest June on record! (since 1972).
May 2018 Very dry with temperatures way above normal and above average sunshine.
Spring 2018
In the three months March, April & May total rainfall was 236.2 mm (98% of normal).
April 2018
The wettest and dullest April for six years.
March 2018
A cold sunless one. More frost, snow and wind than usual.
February 2018
Cold, sunny and relatively dry.
Winter 2017-18
December and January were mild but a cold February brought the figures close to normal.
January 2018
Very wet, very dull and windy. 42% extra rain, 32% less sunshine and 28% more wind.
December 2017
A miserable month with low sunshine, many sunless days and many totally inclement days.
November 2017
Though average over all there were some notable aspects.
Autumn 2017 In the three months September, October and November total rainfall was 509.5 mm (137% of normal).
October 2017
Very wet, very dull, very windy and very mild.
|
| Late Spring and Early Autumn ground frosts
Huncoat averages 34 ground frosts per year.
Out of 44 Springs-
The last frosts have occurred 28 times in April, 8 in March, 6 in May and one each in February and June.
Out of 45 Autumns-
The first frosts have occurred 22 times in October, 20 times in November, twice in December and once in September. |
| Latest News on Arctic Sea Ice |
The ten lowest maximums in the satellite record of Arctic sea ice have occurred in the last ten years. High (Arctic) latitudes are warming more than the mid latitudes leading to weakening of the pressure gradient allowing greater meandering of the Polar Jet Stream.
Arctic sea ice is just one of several drivers of the Jet Stream behaviour causing climatic variations in Britain. |
| Rainfall.......at Huncoat (in inches) | |||||||||||||
| Year | Jan | Feb | Mar | Apr | May | Jun | Jul | Aug | Sep | Oct | Nov | Dec | Total |
|---|---|---|---|---|---|---|---|---|---|---|---|---|---|
| 2000 | 5.48 | 6.08 | 4.93 | 4.58 | 3.20 | 5.07 | 3.24 | 4.01 | 5.80 | 11.02 | 9.43 | 4.70 | 67.54 |
| 2001 | 3.08 | 5.23 | 2.59 | 4.78 | 3.11 | 2.67 | 1.91 | 5.33 | 6.04 | 7.22 | 4.33 | 3.18 | 49.47 |
| 2002 | 4.10 | 10.90 | 1.85 | 2.39 | 5.51 | 4.31 | 5.72 | 5.12 | 1.97 | 6.22 | 5.14 | 5.23 | 58.46 |
| 2003 | 3.58 | 1.90 | 3.10 | 2.75 | 5.33 | 4.17 | 3.55 | 2.14 | 3.23 | 1.62 | 5.27 | 5.20 | 41.84 |
| 2004 | 6.39 | 3.39 | 2.39 | 3.94 | 2.51 | 4.26 | 3.03 | 9.70 | 4.23 | 6.58 | 4.06 | 5.27 | 55.75 |
| 2005 | 5.21 | 3.55 | 1.40 | 4.72 | 3.00 | 2.90 | 3.20 | 3.37 | 4.15 | 4.27 | 5.65 | 3.37 | 44.79 |
| 2006 | 1.66 | 2.66 | 6.31 | 2.83 | 6.77 | 1.19 | 1.23 | 5.88 | 4.69 | 5.71 | 6.23 | 8.31 | 53.47 |
| 2007 | 6.47 | 3.55 | 3.40 | 0.83 | 5.50 | 7.70 | 7.90 | 2.79 | 5.08 | 1.81 | 3.41 | 6.79 | 55.23 |
| 2008 | 10.79 | 3.09 | 5.32 | 2.65 | 1.07 | 3.79 | 5.80 | 6.83 | 6.54 | 7.71 | 3.12 | 4.75 | 61.46 |
| 2009 | 4.38 | 0.90 | 2.55 | 1.80 | 4.58 | 1.99 | 7.61 | 3.76 | 2.29 | 4.67 | 9.98 | 3.25 | 47.76 |
| 2010 | 2.61 | 2.63 | 3.28 | 0.95 | 0.72 | 1.83 | 4.85 | 4.20 | 7.36 | 3.54 | 6.32 | 1.65 | 39.94 |
| 2011 | 3.81 | 7.28 | 0.83 | 0.80 | 4.68 | 3.38 | 3.78 | 4.70 | 5.19 | 6.01 | 2.81 | 8.71 | 52.00 |
| 2012 | 5.97 | 3.38 | 0.81 | 4.98 | 3.60 | 8.54 | 7.11 | 4.88 | 9.45 | 5.59 | 5.56 | 9.81 | 69.68 |
| 2013 | 4.55 | 2.09 | 1.91 | 1.28 | 3.91 | 2.21 | 4.47 | 2.15 | 2.79 | 6.35 | 3.21 | 5.68 | 40.60 |
| 2014 | 7.89 | 6.81 | 4.03 | 2.95 | 4.40 | 2.14 | 2.94 | 5.79 | 0.76 | 4.48 | 2.83 | 7.64 | 52.66 |
| 2015 | 5.86 | 1.67 | 4.44 | 1.75 | 4.80 | 2.17 | 4.71 | 3.10 | 2.45 | 3.04 | 11.55 | 12.90 | 58.44 |
| 2016 | 8.34 | 5.73 | 4.14 | 3.22 | 1.90 | 3.28 | 4.81 | 5.75 | 2.65 | 1.48 | 6.17 | 2.75 | 50.22 |
| 2017 | 2.94 | 4.25 | 8.19 | 1.98 | 1.66 | 5.22 | 6.27 | 4.34 | 6.96 | 6.37 | 6.73 | 4.77 | 59.68 |
| 2018 | 7.22 | 2.55 | 3.95 | 4.36 | 0.99 | 1.86 | 2.79 | 3.68 | 5.69 | 3.16 | 2.74 | . | 38.99 |
| Average* | 5.09 | 3.59 | 3.66 | 2.78 | 3.02 | 3.64 | 3.49 | 4.00 | 4.47 | 5.27 | 5.06 | 5.58 | 49.64 |
| *40 years from 1973 | Wettest year - 2012 = 69.68 ins. Driest year - 1995 = 33.66 ins. | ||||||||||||
| Wettest ever month - Dec 2015 = 12.90 ins. Driest ever month - Apr 1980 = 0.11 ins. | |||||||||||||


| Sunshine.......at Huncoat (in hours) | |||||||||||||
| Year | Jan | Feb | Mar | Apr | May | Jun | Jul | Aug | Sep | Oct | Nov | Dec | Total |
|---|---|---|---|---|---|---|---|---|---|---|---|---|---|
| 2002 | 32 | 40 | 95 | 156 | 147 | 128 | 119 | 117 | 149 | 77 | 60 | 54 | 1174 |
| 2003 | 74 | 108 | 145 | 180 | 168 | 180 | 168 | 169 | 149 | 81 | 63 | 80 | 1565 |
| 2004 | 35 | 96 | 90 | 114 | 231 | 165 | 140 | 163 | 110 | 86 | 42 | 60 | 1332 |
| 2005 | 32 | 72 | 80 | 144 | 210 | 180 | 133 | 189 | 148 | 77 | 90 | 66 | 1421 |
| 2006 | 45 | 64 | 75 | 180 | 168 | 173 | 294 | 110 | 154 | 76 | 74 | 39 | 1452 |
| 2007 | 50 | 76 | 120 | 174 | 154 | 165 | 147 | 137 | 94 | 95 | 56 | 69 | 1337 |
| 2008 | 26 | 100 | 75 | 96 | 196 | 158 | 126 | 85 | 94 | 72 | 63 | 60 | 1156 |
| 2009 | 70 | 44 | 110 | 162 | 182 | 195 | 161 | 124 | 94 | 77 | 35 | 66 | 1320 |
| 2010 | 70 | 52 | 110 | 156 | 168 | 218 | 98 | 137 | 138 | 108 | 101 | 75 | 1431 |
| 2011 | 44 | 48 | 113 | 204 | 154 | 158 | 186 | 87 | 103 | 50 | 49 | 20 | 1216 |
| 2012 | 58 | 44 | 135 | 84 | 182 | 94 | 95 | 105 | 60 | 74 | 63 | 48 | 1042 |
| 2013 | 19 | 74 | 63 | 141 | 98 | 154 | 242 | 126 | 78 | 32 | 71 | 36 | 1134 |
| 2014 | 36 | 50 | 108 | 134 | 142 | 185 | 231 | 144 | 99 | 62 | 75 | 43 | 1309 |
| 2015 | 45 | 60 | 103 | 169 | 141 | 145 | 148 | 119 | 142 | 68 | 27 | 32 | 1199 |
| 2016 | 17 | 74 | 82 | 121 | 206 | 131 | 104 | 108 | 109 | 111 | 72 | 52 | 1187 |
| 2017 | 56 | 32 | 101 | 129 | 176 | 108 | 175 | 133 | 58 | 39 | 67 | 39 | 1113 |
| 2018 | 32 | 99 | 57 | 89 | 260 | 258 | 218 | 103 | 101 | 96 | 72 | . | 1385 |
| Average* | 46 | 54 | 75 | 110 | 152 | 137 | 136 | 129 | 96 | 71 | 49 | 44 | 1100 |
| *41 years from 1972 | Sunniest year - 2003 = 1565 hours, Dullest year - 1986 = 821 hours. | ||||||||||||
| Sunniest ever month - July 2006 = 294 hours, Dullest ever month - Dec 1975 = 15 hours. | |||||||||||||
| Please note that these are not precise readings taken with scientific instruments but careful estimates based upon personal observation of hourly cloud and sunlight conditions. This feeds into a specially worked out formula which has served me well over the years to calculate sunshine amounts. I am confident that the table is a good indicator of "sunshine" in Hyndburn and the values are periodically checked against other local sources to ensure reliability. | |||||||||||||
| Mean Temperature.....at Huncoat (in celsius) Accuracy of instruments used verified by calibrated Tinytag Logger in November 2015. |
| Minimum | Jan | Feb | Mar | Apr | May | Jun | Jul | Aug | Sep | Oct | Nov | Dec |
|---|---|---|---|---|---|---|---|---|---|---|---|---|
| 30 year average | 1.6 | 1.1 | 2.9 | 4.5 | 7.6 | 10.7 | 12.9 | 12.5 | 10.2 | 7.4 | 4.3 | 2.2 |
| 2010 | -0.3 | 0.2 | 3.0 | 4.8 | 6.9 | 11.4 | 13.0 | 11.6 | 10.7 | 7.4 | 2.9 | -1.9 |
| 2011 | 1.8 | 4.2 | 3.6 | 7.6 | 8.2 | 10.3 | 11.8 | 12.1 | 11.5 | 9.5 | 7.4 | 3.6 |
| 2012 | 2.8 | 2.4 | 5.2 | 4.0 | 7.4 | 10.2 | 12.0 | 12.9 | 9.7 | 6.3 | 4.4 | 2.5 |
| 2013 | 1.7 | 0.6 | -0.9 | 3.2 | 6.4 | 10.1 | 14.1 | 13.0 | 9.8 | 9.3 | 2.9 | 3.7 |
| 2014 | 3.2 | 3.0 | 3.6 | 6.4 | 8.6 | 11.4 | 13.5 | 11.3 | 10.9 | 8.4 | 6.4 | 2.6 |
| 2015 | 1.7 | 1.3 | 2.5 | 4.1 | 6.7 | 9.7 | 11.9 | 12.0 | 8.7 | 7.8 | 6.0 | 5.7 |
| 2016 | 2.9 | 1.4 | 2.6 | 3.2 | 8.4 | 12.2 | 13.0 | 12.8 | 12.2 | 7.7 | 2.6 | 4.8 |
| 2017 | 2.1 | 3.5 | 4.7 | 5.2 | 9.1 | 11.8 | 12.2 | 11.8 | 10.0 | 8.8 | 3.8 | 2.4 |
| 2018 | 2.2 | 0.2 | 1.4 | 5.7 | 8.9 | 11.8 | 13.8 | 12.8 | 9.6 | 6.8 | 5.3 | . |
| Maximum | Jan | Feb | Mar | Apr | May | Jun | Jul | Aug | Sep | Oct | Nov | Dec |
|---|---|---|---|---|---|---|---|---|---|---|---|---|
| 30 year average | 5.0 | 5.5 | 8.0 | 11.2 | 15.3 | 17.8 | 19.9 | 19.2 | 16.2 | 12.2 | 8.1 | 5.4 |
| 2010 | 2.5 | 3.9 | 9.1 | 12.6 | 14.8 | 19.7 | 19.0 | 17.4 | 16.2 | 12.4 | 6.4 | 2.0 |
| 2011 | 5.1 | 7.9 | 9.7 | 15.8 | 14.7 | 17.2 | 18.7 | 17.2 | 16.9 | 14.0 | 11.2 | 7.0 |
| 2012 | 6.6 | 6.1 | 11.8 | 9.7 | 15.5 | 16.2 | 17.8 | 19.1 | 14.7 | 11.1 | 8.2 | 5.9 |
| 2013 | 4.9 | 5.1 | 4.8 | 10.6 | 13.4 | 17.9 | 22.3 | 19.8 | 15.8 | 13.8 | 8.0 | 8.1 |
| 2014 | 6.8 | 7.3 | 9.8 | 13.2 | 15.4 | 19.1 | 21.5 | 17.4 | 18.0 | 13.8 | 10.0 | 6.7 |
| 2015 | 5.8 | 5.9 | 8.4 | 12.9 | 13.1 | 17.8 | 18.3 | 19.0 | 15.6 | 13.1 | 10.9 | 10.9 |
| 2016 | 7.0 | 6.5 | 8.3 | 10.1 | 16.4 | 18.8 | 18.8 | 18.9 | 18.1 | 12.9 | 7.0 | 8.6 |
| 2017 | 6.0 | 7.4 | 10.6 | 11.4 | 17.2 | 18.1 | 19.0 | 18.0 | 15.6 | 13.5 | 8.5 | 6.4 |
| 2018 | 6.2 | 4.7 | 6.8 | 12.2 | 18.5 | 20.9 | 23.4 | 18.4 | 15.4 | 12.6 | 9.3 | . |
| Monthly Mean | Jan | Feb | Mar | Apr | May | Jun | Jul | Aug | Sep | Oct | Nov | Dec |
|---|---|---|---|---|---|---|---|---|---|---|---|---|
| 30 year average | 3.3 | 3.3 | 5.5 | 7.8 | 11.4 | 14.2 | 16.4 | 15.8 | 13.1 | 9.8 | 6.2 | 3.8 |
| 2010 | 1.1 | 2.1 | 6.0 | 8.7 | 10.9 | 15.5 | 16.0 | 14.5 | 13.4 | 9.9 | 4.6 | 0.0 |
| 2011 | 3.5 | 6.1 | 6.7 | 11.7 | 11.5 | 13.7 | 15.2 | 14.7 | 14.2 | 11.8 | 9.3 | 5.3 |
| 2012 | 4.7 | 4.2 | 8.5 | 6.9 | 11.4 | 13.2 | 14.9 | 16.0 | 12.2 | 8.7 | 6.3 | 4.2 |
| 2013 | 3.3 | 2.8 | 2.0 | 6.9 | 9.9 | 14.0 | 18.2 | 16.4 | 12.8 | 11.5 | 5.5 | 5.9 |
| 2014 | 5.0 | 5.1 | 6.7 | 9.8 | 12.0 | 15.2 | 17.5 | 14.3 | 14.5 | 11.1 | 8.2 | 4.7 |
| 2015 | 3.7 | 3.6 | 5.4 | 8.5 | 9.9 | 13.7 | 15.1 | 15.5 | 12.2 | 10.5 | 8.4 | 8.3 |
| 2016 | 4.9 | 3.9 | 5.5 | 6.7 | 12.4 | 15.5 | 15.9 | 15.8 | 15.1 | 10.3 | 4.8 | 6.7 |
| 2017 | 4.1 | 5.5 | 7.6 | 8.3 | 13.1 | 14.9 | 15.6 | 14.9 | 12.8 | 11.1 | 6.2 | 4.4 |
| 2018 | 4.2 | 2.5 | 4.1 | 8.9 | 13.7 | 16.3 | 18.6 | 15.6 | 12.5 | 9.7 | 7.3 | . |
| Older Data | |
| The above charts are updated every month. However, if requested further data can be supplied about Hyndburn weather as follows.... | |
| Annual Rainfall from 1870 | Monthly and Daily Rainfall from 1973 |
| Incidence of Snowfall from 1960 | Sunshine estimates from 1972 |
| Barograph traces from 1974 | Temperature Data from 1974 |
| Drought records from 1995 | Monthly Reviews from 1972 |
| Local Extreme Weather Phenomena | Lists of warm, dry or cold spells |
| Data can be made available in metric or imperial measurements | |
| Please contact me with your requirements or questions. There may be a charge for large amounts of information. | |
A study by Roy Chetham first compiled in October 2003 and up-dated in November 2013. Huncoat is a small historic village some 30 miles inland between Accrington and Burnley. As a consequence of being situated on the western slopes of the Pennines below the 1,340 feet high Great Hameldon it receives quite high annual rainfall, records of which, go back to 1875. The earliest known record of rainfall in Britain was kept by Richard Towneley (1629-1707) of Towneley Hall in Burnley, which is just 5 miles east of Huncoat. He placed a funnel on the roof connected to a tube leading down to his bedroom window and measured and recorded the rainfall between 1677 and 1703. He found the annual mean fall to be 41.00 inches (1,041.4mm). His bedroom was in the east wing of the quadrangle which was removed early in the 18th Century so is no longer in existence. Comprehensive records began to be kept around 1726 but it was not until 1860 that they were collected together systematically. George James Symons (1838-1900) took an interest in rainfall after the drought years of 1857-59. He took up a post with the Royal Meteorological Society and began to publish a series of annual books entitled "British Rainfall". The first issue was really only a pamphlet giving the data from 168 �English� stations for 1860 but the enterprise quickly grew and within a quarter of a century he was publishing thick volumes containing over 2000 �British� rainfall recording stations and by the Centenary these exceeded 6000. Symons died in March 1890 aged 61 but the venture was continued by his assistant Herbert Sowerby Wallis and subsequently Hugh Robert Mill and Carle S. Salter until after the First World War it was absorbed into the Meteorological Office Air Ministry. In the 1860 table the nearest station to Huncoat was Stonyhurst which returned 50.60 inches in that year. The annual mean fall at Stonyhurst from 1850 to 1977 was 47.55 inches (1,207.8 mm). Huncoat first appeared in the "British Rainfall" books in 1875 with readings taken at Burnley Road Reservoirs. Unfortunately, that station disappeared in 1982 but from 1961 readings had also been taken at the nearby Mitchell's House Reservoir at the head of Warmden Clough and those continue to this day. Rainfall was also recorded in Oak Hill Park, Accrington from 1939 until 1961, at Burnley Road Cemetery, Accrington from 1985 until 1997, at Coppy Clough Sewage works Church from 1947 to 1973 and at Jackhouse Reservoir Oswaldtwistle from 1870 to 1881 and 1966 to 1982. Sadly, the Meteorological Office discontinued the publication of Rainfall Books after 1991 on economic grounds but the local water authorities still continue to measure and report rainfall amounts to the Environment Agency and Meteorological Office and the data eventually gets into their National Library and Archive at Exeter. In April 2010 the Royal Meteorological Society organised a meeting in London to mark the 150th Anniversary of the founding of the British Rainfall Organisation. To see my report of that event click here. The modern rainfall recording network is governed by the Met Office who inspect the sites once every three years to make sure each site conforms to the required standards and is producing good data. The Environment Agency maintains a network of tipping bucket rain gauges to supply information of relevance to flood defences and bathing water quality. The first �tipping bucket� rain gauge was made in 1662 by Sir Christopher Wren but the first recorded attempt to measure rainfall was by Benedetto Castelli, Italian mathematician, astronomer, Benedictine monk and student of Galileo. He measured an eight hour fall at Perugia in Italy in 1639 but appears not to have kept any continuous records. The rim diameter of a standard rain gauge is 12.7cm (5 inches) and the height of the mouth should be 30cm above ground level but anything between 15 and 50cm would result in very little error. The standard rain gauge is called a �Snowdon� pattern because it became approved after Captain Mathew used it for an extensive series of observations on the lower slopes of Snowdon in 1865. In fact the design was first employed by Col. M.F. Ward at Calne in 1862 having been made by a local chemist named Rowdon. In the early 1970's John, David, Martin and Roy began measuring rainfall in Accrington and from 1992 Roy has done so at Sutton Crescent in Huncoat. In 2003 Jim joined the club taking readings in Oswaldtwistle and in 2005 David�s station moved to Oswaldtwistle. Mitchell's House Reservoir is 980 feet above sea level just south west of Great Hameldon and less than 2 miles away from Huncoat village. The "Huncoat Data" therefore all comes from within a small radius. Most of the readings taken over the years at all the above sites compare quite well with each other so we can be pretty sure that we have an accurate picture of local rainfall patterns and extremes. Moreover, rainfall was recorded at Stonyhurst College (7 miles to the NW) for 100 years and that data also collaborates the Huncoat figures. The 135 year average for Huncoat is nearly 50 inches (1,270 millimetres) per annum. Since 1875 there is no evidence that this has increased so it does not indicate that our climate is getting any wetter. The wettest ten year average was 53.39 inches (1,356 millimetres) between 1922 and 1931. The driest ten year average was 40.42 inches (1,027 millimetres) between 1892 and 1901. Huncoat�s wettest years have been 1981 with 67.05 inches (1,703 millimetres) at Mitchell's House Reservoir, 2000 with 67.54 inches (1,716 millimetres) at Sutton Crescent and 2012 with 69.68 inches (1,771 millimetres) at Sutton Crescent. Huncoat�s driest years have been 1887 with 28.62 inches (727 millimetres) at Burnley Road Reservoir, 1933 with 31.37 inches (797 millimetres) at Burnley Road Reservoir and 1995 with 33.66 inches (855 millimetres) at Sutton Crescent. To see a full table of historic annual rainfall totals at Huncoat click here. The wettest places in Britain are firmly established as the Cumbrian and Snowdonian mountains. Here the annual average rainfall is around 200 inches (5,080 millimetres).
Taken over 30 years up to 2010 the average annual fall at Crib Goch in Snowdonia was 182.5 inches (4,635 millimetres).
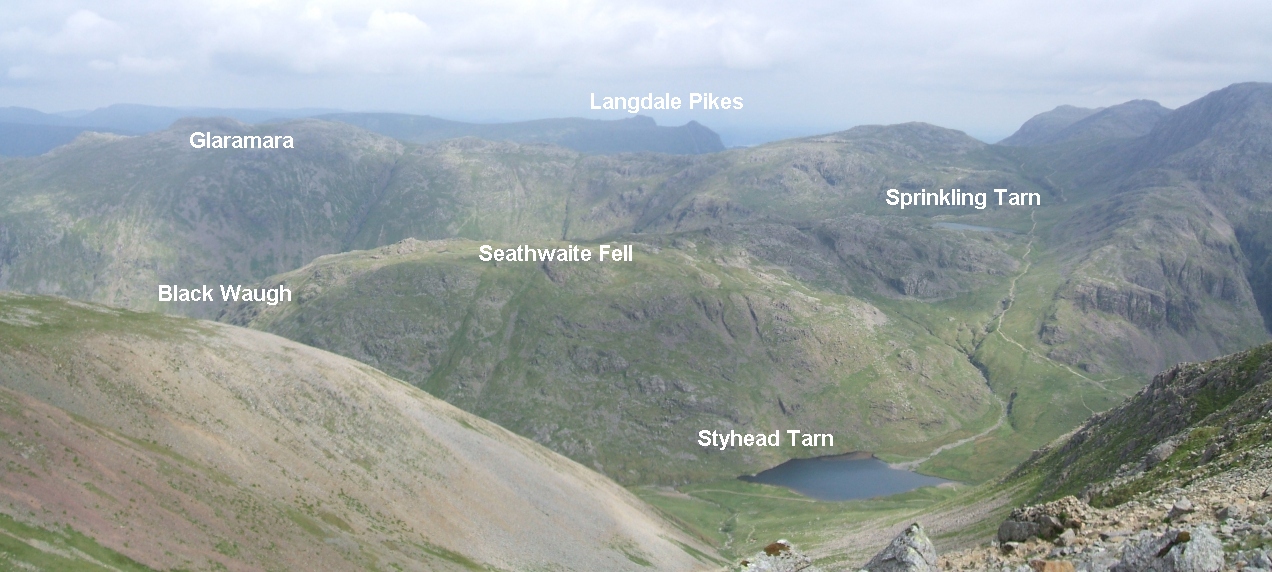
Over the same period the average annual fall at the Stye on the front of Seathwaite Fell in Borrowdale, Cumbria was virtually the same.
 Surprisingly, despite possible impressions to the contrary Scotland is not as wet as Cumbria or Snowdonia. The highest annual average in Scotland was 160.78 inches (4,083.8 millimetres) at Ben Nevis Observatory during the 19 years of operation from 1885 to 1903. The highest annual totals in Scotland have been 240.13 inches (6,099 millimetres) at Ben Nevis Observatory in 1898 and 213.00 inches (5,410 millimetres) at Loch Quoich Knoydart in 1938. The wettest place in Northern Ireland seems to be Slieve Bearnagh in the Mountains of Mourne with an annual average of only 74.20 inches (1884.7 millimetres) and in Southern Ireland it�s the Ballaghbeena Gap in Macgillycuddys Reeks mountains, County Kerry with an annual average of around 100.00 inches (2,540 millimetres). The legend of the Stye site in Borrowdale began in 1845 when Dr. J. Fletcher Miller of Whitehaven established the first rain gauge at nearby Seathwaite in the garden of Mr. John Dixon. Dr. Miller also placed rain gauges higher in the mountains because he suspected higher falls occurred there. This proved to be the case at the notorious location known as �The Stye,� a shelf on Black Waugh Crag which seemed to suffer converging rain bearing clouds coming over Styhead Pass. It may not be unrelated that the highest mountain in England, Scafell Pike is a bare two miles away. Sadly, most of the mountain gauges except The Stye were abandoned in 1853 frequently proving inaccessible due to ice and snow and Miller died in 1856. However, Mr Dixon continued to record at the Seathwaite site and measurements of rainfall there have continued unbroken to the present day. The 165 year average is 131.12 inches (3,330.5 millimetres). Until 1857 Mr. Dixon also managed to record the readings from The Stye but then there was a gap until Mr. Isaac Fletcher a relative of Dr. Miller tried to re-establish the mountain network in 1864 but after 1869 they were again neglected. Isaac Fletcher conducted careful experiments to compare the fall of rain in the Seathwaite gauge with that at the Stye. It was already clear by comparison of the records at each place that the mountain site was 25% wetter than the valley site. However, he also concluded that gauges emptied only monthly, as is the case with mountain stations, may lose up to 11�% of their potential catch through evaporation, hail and snow. This could make the true annual mean fall at the Stye to be in the region of 210 inches (5,334 mm). The mountain network was revived in 1877 by a Mr. Maitland of Hyde Park with the assistance of Mr. Wilson of Wasdale and since then the Stye site at least has continued with short interruptions until the present day. In 1929 after one of these short interruptions through lack of an observer the name was changed to Stye Head which is rather confusing with the more popularly known Sty Head pass and tarn being only a mile to the SW. Nevertheless, this is still the same location as established by Dr. Miller in 1845. It is at a height of 1,077 feet (328 metres) about 200 yards off the footpath to Styhead Tarn. There have been at least four gauge sites here all within a range of 200 yards, see the sepia coloured map click here.
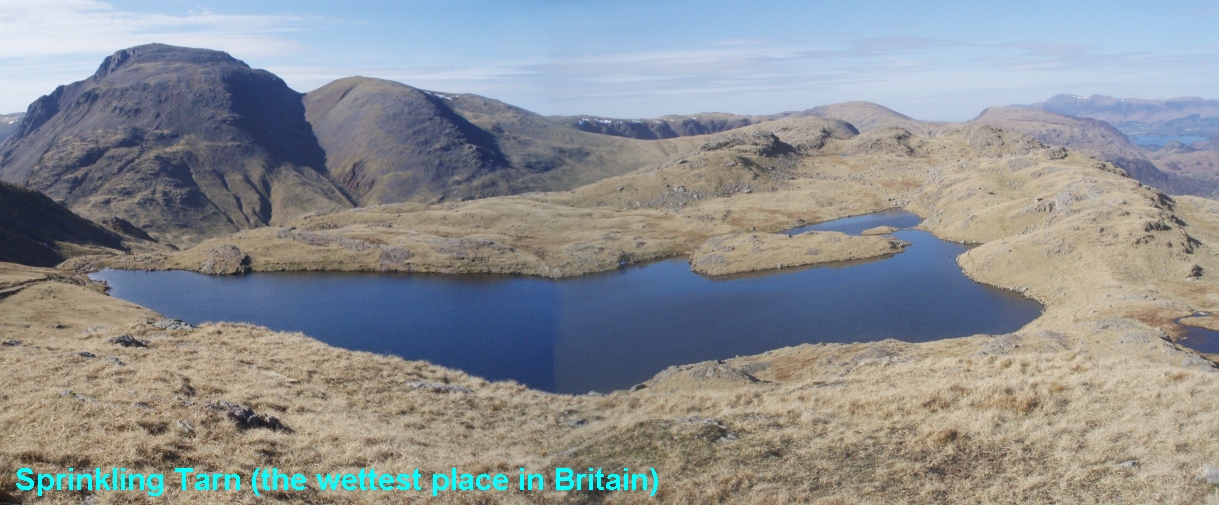
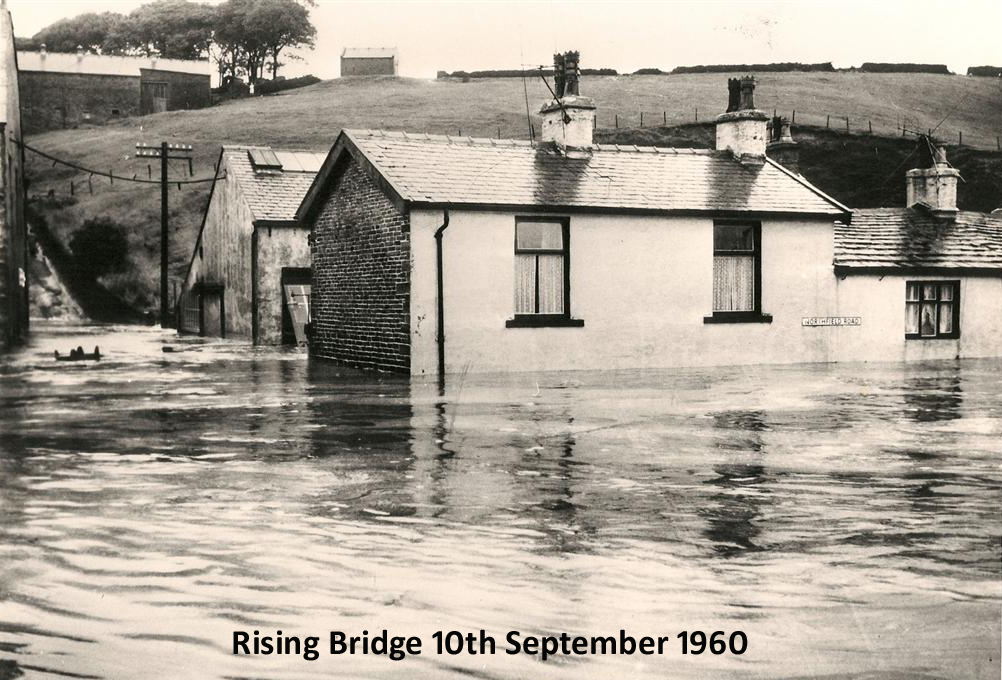
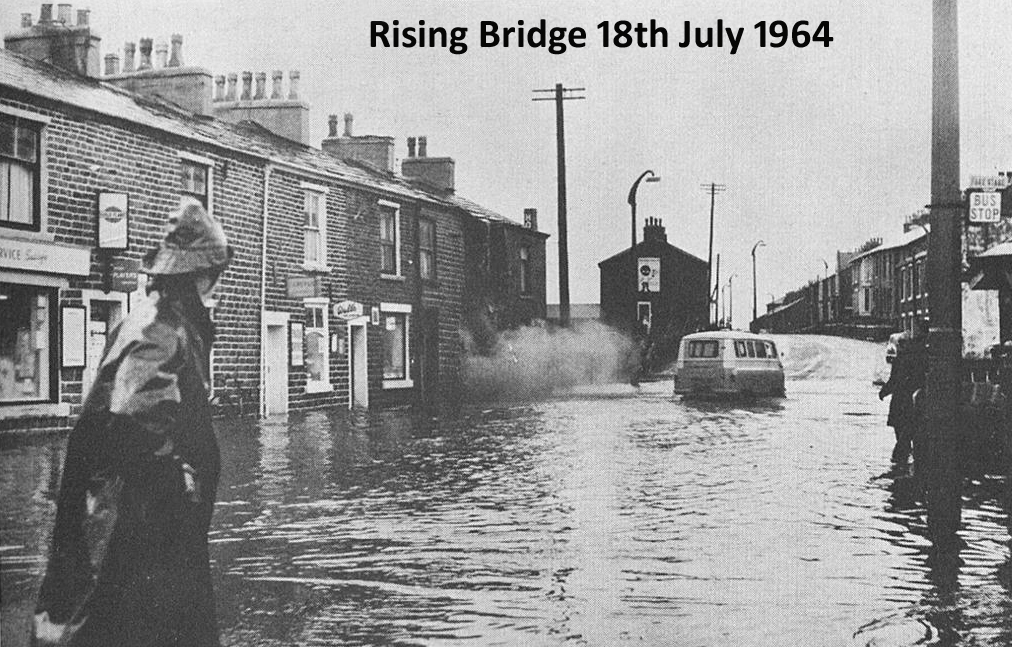
 The record breaking site of Sprinkling Tarn was located at a height of 1990 feet (607 metres) but closed in 1987. There have been higher rain gauges in the Cumbrian mountains but they did not record greater falls. Ullscarf just to the SW of Thirlmere was at a height of 2100 feet (640 metres) until it closed in 2005 but the annual average there was only 119 inches (3,022 millimetres). The two highest sites for rain gauges with recent reports are Crib Goch at 2,339 feet (713 metres) and Birkside on Dollywaggon Pike near Helvellyn at 2,096 feet (639 metres). A strange contradiction was noted by the early observers. The wettest places in the Cumbrian mountains were at a height of between 1,000 to 1,500 feet, higher up on the summits appeared to be less wet. The Ben Nevis records however, indicated the greatest fall was on the summit not half way up and 76% more than on the loch side at Fort William. Heavy rain and consequent flooding can occur virtually anywhere particularly if culverts or river courses have become blocked by fallen trees etc or the natural flood plain has become compromised by building development. The most serious flood events can follow intense localised thunderstorms or prolonged cyclonic rainfall over high ground draining into converging valleys. Some examples are - On 9th July 1870 a disastrous thunderstorm passed over Accrington and fell with its full force upon Heald Moor and Flower Scar totally inundating the Calder valley between Burnley and Todmorden. The area most affected was around Portsmouth which was flooded. No rain gauge captured the fall but it was estimated from river flows to have exceeded 9 inches in two hours. The small coastal town of Lynmouth became known throughout the world for the disaster that struck on 15th August 1952. After 9.00 inches (229 millimetres) fell upon the Chains; the western part of Exmoor, the East and West Lyn Rivers rose suddenly and swept large boulders and rocks through the village, destroying houses, roads and bridges. Floods in Rising Bridge near Accrington on Saturday 10th September 1960 were caused by a breach in the dam of Cat Clough lodge at Stone Fold. Terrific thunderstorms affected all the Accrington area on Wakes Week Saturday 18th July 1964. Over 3.00 inches of rain fell in 24 hours but most of it within the 8 hours 9am to 5pm causing the worst floods in living memory. A bakers shop at Rising Bridge collapsed into a culvert and two homes in Station Road Huncoat were flooded by a burst drain. Hyndburn Road and Grange Lane were badly flooded and many local mills were put out of action for several days. 3.10 inches were measured at Mitchell�s House Reservoir, 3.03 inches at Buttock near Pendle and 2.18 at Coppy Clough sewage works. The month�s total at Mitchell�s House was 6.81 inches. On 20th September 1968 a fall of 3.20 inches was measured at Oak Hill Park, 3.76 at Buttock and 4.00 at Holden near Helmshore but no serious floods resulted.
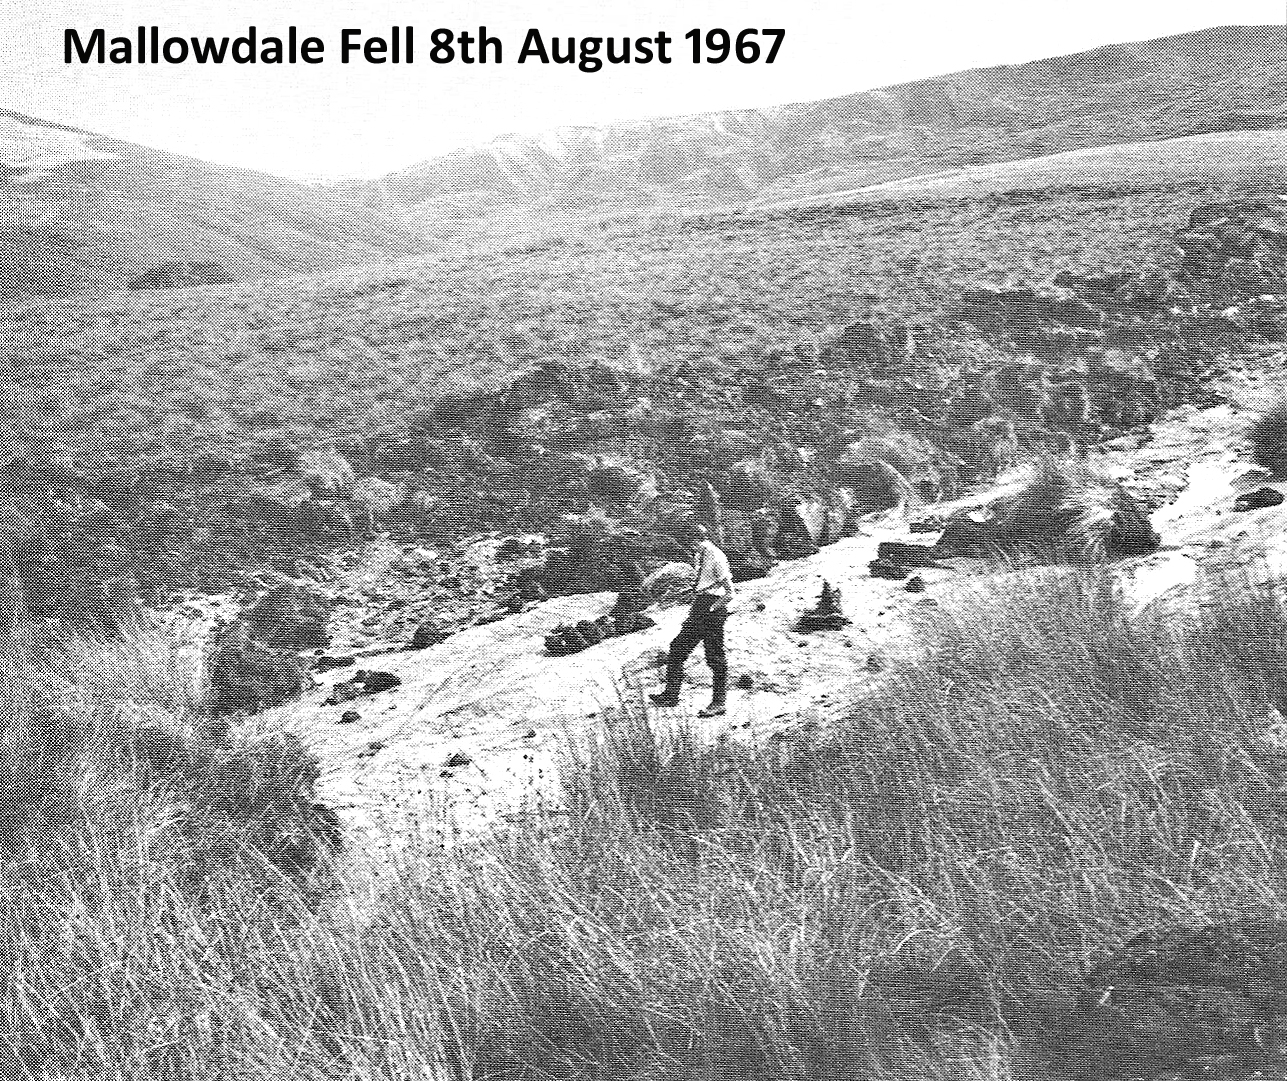
 . .  The village of Wray near Hornby suffered a terrible flood on 8th August 1967. A thunderstorm put at least 3.00 inches down in a very short time on the catchment of the River Roeburn. Trees and rubble washed down in the torrent dammed up for a time and then broke through in a great rush carrying away cottages and bridges. The same thunderstorm seems to have caused 3.25 inches in two hours at Ogden and Buttock gauges on the slopes of Pendle. Similar deluges were recorded in the Trough of Bowland and Stocks Reservoir areas. The months total exceeded 16 inches in some of these places compared to 10.51 inches at Seathwaite Farm and 6.42 at Huncoat. Frank Ibbetson of High Salter Farm walked the track of the storm the following day and found a great crater on Mallowdale Fell where the storm seemed to have stood still for a while. It may have been held in place by an uplift of warm air from the hot moorland creating this ground eroding cloudburst.
 Before the Boscastle flood on 17th August 2004, 7.89 inches (200 millimetres) fell in 24 hours on the Cornish uplands. Carlisle was submerged on 8th January 2005 because of 8.85 inches (225 millimetres) in 72 hours over the Shap Mountains and 4.53 inches (115 millimetres) in 24 hours at Keswick. A very localised cloudburst affected Accrington, Oswaldtwistle and Clayton on Saturday 27th June 2009 when over one inch of rain fell within an hour. Town centre roads and properties were briefly flooded and drains became fountains. Bizarrely, nearby places like Huncoat and the Ribble Valley escaped the downpour! We have not had anything like this since 1968 (a return period of 41 years). The Cockermouth disaster on the afternoon of 19 November 2009 followed 12.40 inches (314.4 millimetres) in 24 hours at Seathwaite in the Cumbrian mountains. The Rivers Derwent and Cocker swept through hundreds of homes and businesses in the town centre the water reaching depths of up to eight feet. Four bridges collapsed and twelve others damaged. The heavy rainfall was the main cause but rivers had been undredged for years and a relief archway at Gote Bridge (added after an earlier traumatic flood) was partially silted up when the floods struck. The Calderdale Floods of Friday 22 June 2012 were caused by up to 2 inches (50mm) falling in 12 hours on to already saturated catchments and Hebden Bridge, Todmorden and Mytholmroyd are in the rapid response Upper Calder catchment area.
The December floods of 2015 were particularly widespread.
The wettest days ever officially recorded in England were �
The wettest days ever officially recorded in the Huncoat area were - Droughts A shortage of rainfall leading to low reservoir levels is usually termed a drought. However, technically there are very precise definitions. An �Absolute Drought� is when there is a period of 15 consecutive days without measurable rainfall (less than 0.01 inches or 0.25 millimetres per day) although if there are 29 consecutive days where the average daily rainfall does not exceed 0.01 inches then that is a �Partial Drought.� If there are 15 consecutive days on each of which there is less than 0.04 inches or 1.0 millimetres then that is defined as a �Dry Spell.�
The longest local drought in living memory was an Absolute Drought of 33 days in February and March 1953. July and August of the same year also had a Dry spell of 17 days. |
A special study by Roy Chetham completed in November 2003.
9th Century
10th Century
11th Century
12th Century
13th Century
14th Century
15th Century
16th Century
17th Century
18th Century
19th Century
20th Century |
An assessment by Roy Chetham in January 2014 |
|
Hyndburn�s position close to the centre of the UK keeps it sheltered from most extremes of heat, drought, cold, snow, frost, wind, storms and flood but being 30 miles inland on the western slopes of the Pennines where the rain bearing clouds get stuck means it receives quite high annual rainfall, records of which can be traced back to 1870. The height of the local townships range from 200 feet where the River Hyndburn ends at Martholme up to 900 feet at Stone Fold, Rising Bridge. The highest point in the locality is Great Hameldon 1,342 feet (sometimes mis-spelt Hambledon) behind which is Hameldon Hill at 1,308 feet where the Met Office Rain Radar installation stands (white golf ball).
The 143 year average rainfall for Hyndburn is nearly 50 inches (1,270 millimetres) per annum. The wettest year on record was 2012 with 69.68 inches (1,771 millimetres) and the driest 1887 with 28.62 inches (727 millimetres). The wettest day ever recorded here was Friday 20th September 1968 when 4.10 inches were measured (104 millimetres). The wettest day this century was Christmas Day 2015 when 3.13 inches fell (79.6 millimetres). A drought of 15 consecutive days without rainfall occurs on average every three years the last one being in March 2012 The highest temperature recorded was 36 degrees Celsius on Thursday 1st July 1976 and the lowest minus 13 Celsius on Monday 12th January 1987. The average sunshine amount for the area is 1,134 hours per annum (equivalent of 3 hours per day). The sunniest month is May and the dullest December. On average there are 35 days in each year with a ground frost, 27 with an air frost and 25 when snow falls. Thunder is heard on average 8 times a year and hail is seen 14 times. It is foggy on 11 days and completely sunless on 106 days. Rarely do wind gusts exceed 50mph. There have been a few weather disasters over the years. On Saturday 9th July 1870 a disastrous thunderstorm passed over Accrington and fell with its full force upon Heald Moor and Flower Scar totally inundating the Calder valley between Burnley and Todmorden. The area most affected was around Portsmouth which was flooded. No rain gauge captured the fall but it was estimated from river flows to have exceeded 9 inches in two hours. Floods in Rising Bridge on Saturday 10th September 1960 were caused by a breach in the dam of Cat Clough lodge near Stone Fold. The most memorable and widely publicised event was the Wakes Week Saturday thunderstorm of 18th July 1964 when many local mills were put out of action for days. Hyndburn Road and Grange Lane were badly flooded and a bakers shop in Rising Bridge collapsed into a culvert. Over 3 inches of rain fell in the 24 hours the bulk of which was during the eight hours 9am to 5pm. More recently a very localised cloudburst affected Accrington, Oswaldtwistle and Clayton on Saturday 27th June 2009 when over one inch of rain fell within an hour. Town centre roads and properties were briefly flooded and drains became fountains. Bizarrely, nearby places like Huncoat and the Ribble Valley escaped the downpour!
Huncoat didn't escape in November and December 2015 when a succession of named storms battered Britain causing widespread flooding. By a remarkable coincidence Saturday seems to be the worst day for floods in Hyndburn! Is our climate changing? Very slightly perhaps. In Hyndburn the 20th Century was 14% wetter than the 19th Century and so far the 21st Century has been 4% wetter than the 20th Century. Summers are not warmer but winters have been generally milder since 1988. However, as yet there is no definite indication that these trends are continuing. |
|
|
Please note that most of these are Automatic Weather Stations (AWS) using a Davis Vantage Pro 2 array of instruments or similar. The rainfall amounts recorded by such installations are not to be 100% trusted unless they are regularly maintained, properly calibrated and checked against Met Office standard manual rain gauge measurements. | |
and removed if the target website was out of date or defective. | |
Continuous weather monitoring and comprehensive archives but not always up to date. http://www.a-sojourn.me.uk/Weather/wx.htm |
Live graphs and tables of current temperature, dewpoint and rainfall. http://www.weathercast.co.uk/world-weather/weather-stations/obsid/99060.html |
Continuous weather monitoring and comprehensive archives. www.lovecloughweatherlive.co.uk |
Continuous weather monitoring and comprehensive archives. https://www.wunderground.com/personal-weather-station/dashboard?ID=IACCRING8#history/s20171122/e20171122/mdaily |
Continuous weather monitoring and comprehensive history. https://www.timeanddate.com/weather/uk/manchester | |
Continuous weather monitoring and comprehensive archives. www.coggabata.co.uk/weather.html |
Continuous weather monitoring and comprehensive archives. www.bramptonweather.co.uk |
Continuous weather monitoring and comprehensive archives. www.mauldsmeaburnweather.co.uk |
Continuous weather monitoring and comprehensive archives. http://www.greatasby.co.uk |
Continuous weather monitoring and comprehensive archives. https://www.wunderground.com/weather/gb/ulverston/54.20000076%2C-3.0999999?cm_ven=localwx_today |
|
Continuous weather monitoring and comprehensive archives. www.llansadwrn-wx.co.uk |
Continuous weather monitoring and comprehensive archives. http://www.windrushweather.co.uk/station/daily-statistics/ |
www.morecambe-weather.info |
www.lakedistrict.gov.uk/weatherline |
https://www.metoffice.gov.uk/public/weather/forecast/gcw3f198q | |
A forum for exchange of weather information. http://www.cumbriaweatherforum.co.uk/ | |
Founded in 1970 by a small group of amateur meteorologists it has now become the enthusiasts' weather observer network for the United Kingdom producing a detailed monthly bulletin. https://www.colweather.org.uk/index.php | |
Read scientific analysis on Arctic sea ice conditions. We provide an update during the first week of each month, or more frequently as conditions warrant. http://nsidc.org/arcticseaicenews/ | |
The on-line depository of ancient British rainfall books. http://www.metoffice.gov.uk/learning/library/archive-hidden-treasures/british-rainfall | |
The latest rainfall radar analysis for northern England. http://www.weatheronline.co.uk/cgi-app/radar?LANG=en&STRUCTUR=_&CREG=nor&CONT=ukuk&ZEIT=201107101215 | |
Site Map |
|